Why Go Solar for Your Business in 2026?
For business owners and CFOs, commercial solar delivers predictable energy costs, substantial tax benefits, and attractive returns as grid prices continue rising faster than inflation.1
Solar provides 25-year cost certainty, with many high-consumption facilities seeing 4–8 year paybacks (site- and tariff-dependent). Demand-charge reduction with battery storage can materially cut bills—often 20–40% for customers whose charges represent a large share of costs.6,7
Federal incentives remain robust in 2026—30% ITC tax credit, accelerated depreciation, and transferability—and can stack with state/utility programs so that eligible projects offset a large share of capital expenditure.2,3,10
This commercial solar playbook is for decision-makers at companies and organizations that own their facilities and pay their own electricity bills with stable long-term occupancy.
The 2026 Landscape: What’s Changed and What Hasn’t
Several converging market forces make 2026 a compelling year for commercial solar investment. Electricity prices continue rising faster than general inflation, with commercial rates in many regions up 15% to 25% since 2022.1 Demand charges, which penalize businesses for their highest 15-minute power draw each month, have become increasingly aggressive as utilities manage grid constraints.
The proliferation of workplace EV charging creates both challenge and opportunity. Businesses adding Level 2 chargers face demand charge spikes that can add $500 to $2,000 monthly unless managed with solar and storage. Simultaneously, corporate ESG reporting requirements now often include Scope 2 emissions (purchased electricity), making solar an attractive decarbonization strategy with measurable metrics.
Federal incentive pathways have evolved but remain strong. The Inflation Reduction Act’s technology-neutral clean energy credits extend favorable treatment through the end of the decade, and the introduction of tax credit transferability in 2023-2024 opened solar to businesses without sufficient tax appetite. State and utility programs vary widely but increasingly focus on commercial and industrial customers, demand response participation, and grid services.
Commercial rates have climbed 15–25% since 2022 in many regions, and EIA expects continued upward pressure through 2026.1 Demand charges—based on the month’s peak 15–30-minute draw—often make up 30–70% of a commercial bill, making them a prime savings lever for solar-plus-storage.6 EV charging adds both risk (peak spikes) and opportunity (managed charging paired with PV+storage). Unmanaged charging can trigger significant demand charges; studies show demand fees can dominate fast-charging economics unless mitigated.8 Meanwhile, corporate ESG reporting increasingly counts Scope 2 electricity, making on-site solar a measurable decarbonization tool.
Federal pathways remain strong: technology-neutral credits run through the decade; credit transferability (sell credits for cash) broadens access; and direct pay applies to tax-exempt entities.9 State/utility rebates and demand-response revenues (for storage) vary but frequently favor commercial/industrial customers.
Commercial Incentives You Can Use (That Homes Can’t)
- Investment Tax Credit (ITC) ~30% for projects meeting prevailing wage/apprenticeship—core value for for-profit entities.2,10
Accelerated depreciation (MACRS)—generally 5-year class life for qualified clean energy/property; taken on eligible basis after ITC reduction.3 - Section 179D deduction for qualifying building efficiency (HVAC, lighting, envelope), up to $5.00/ft² when requirements are met—powerful when paired with solar in a whole-building upgrade.4
- Transferability/direct pay: sell credits (transfer) or receive cash (direct pay for eligible tax-exempts).9
- State/utility programs: rebates, performance incentives, and demand-response revenues for battery participation.
Financing Structures: How Businesses Actually Pay for Solar
- Cash or loan (on-balance-sheet): highest lifetime value; owner keeps tax benefits/RECs.
- Leases (operating/capital): structure-dependent accounting/tax impacts.
- PPA/“as-a-service”: no capex; pay a fixed/kWh rate (often 10–20% below tariff); third party claims tax benefits. Good for limited tax appetite or off-balance treatment.
- C-PACE: long-tenor (often 15–25 years) fixed-rate financing repaid via property assessment that can transfer on sale.5
- Credit transfer: monetize the ITC for cash to de-lever construction or fund other priorities.9
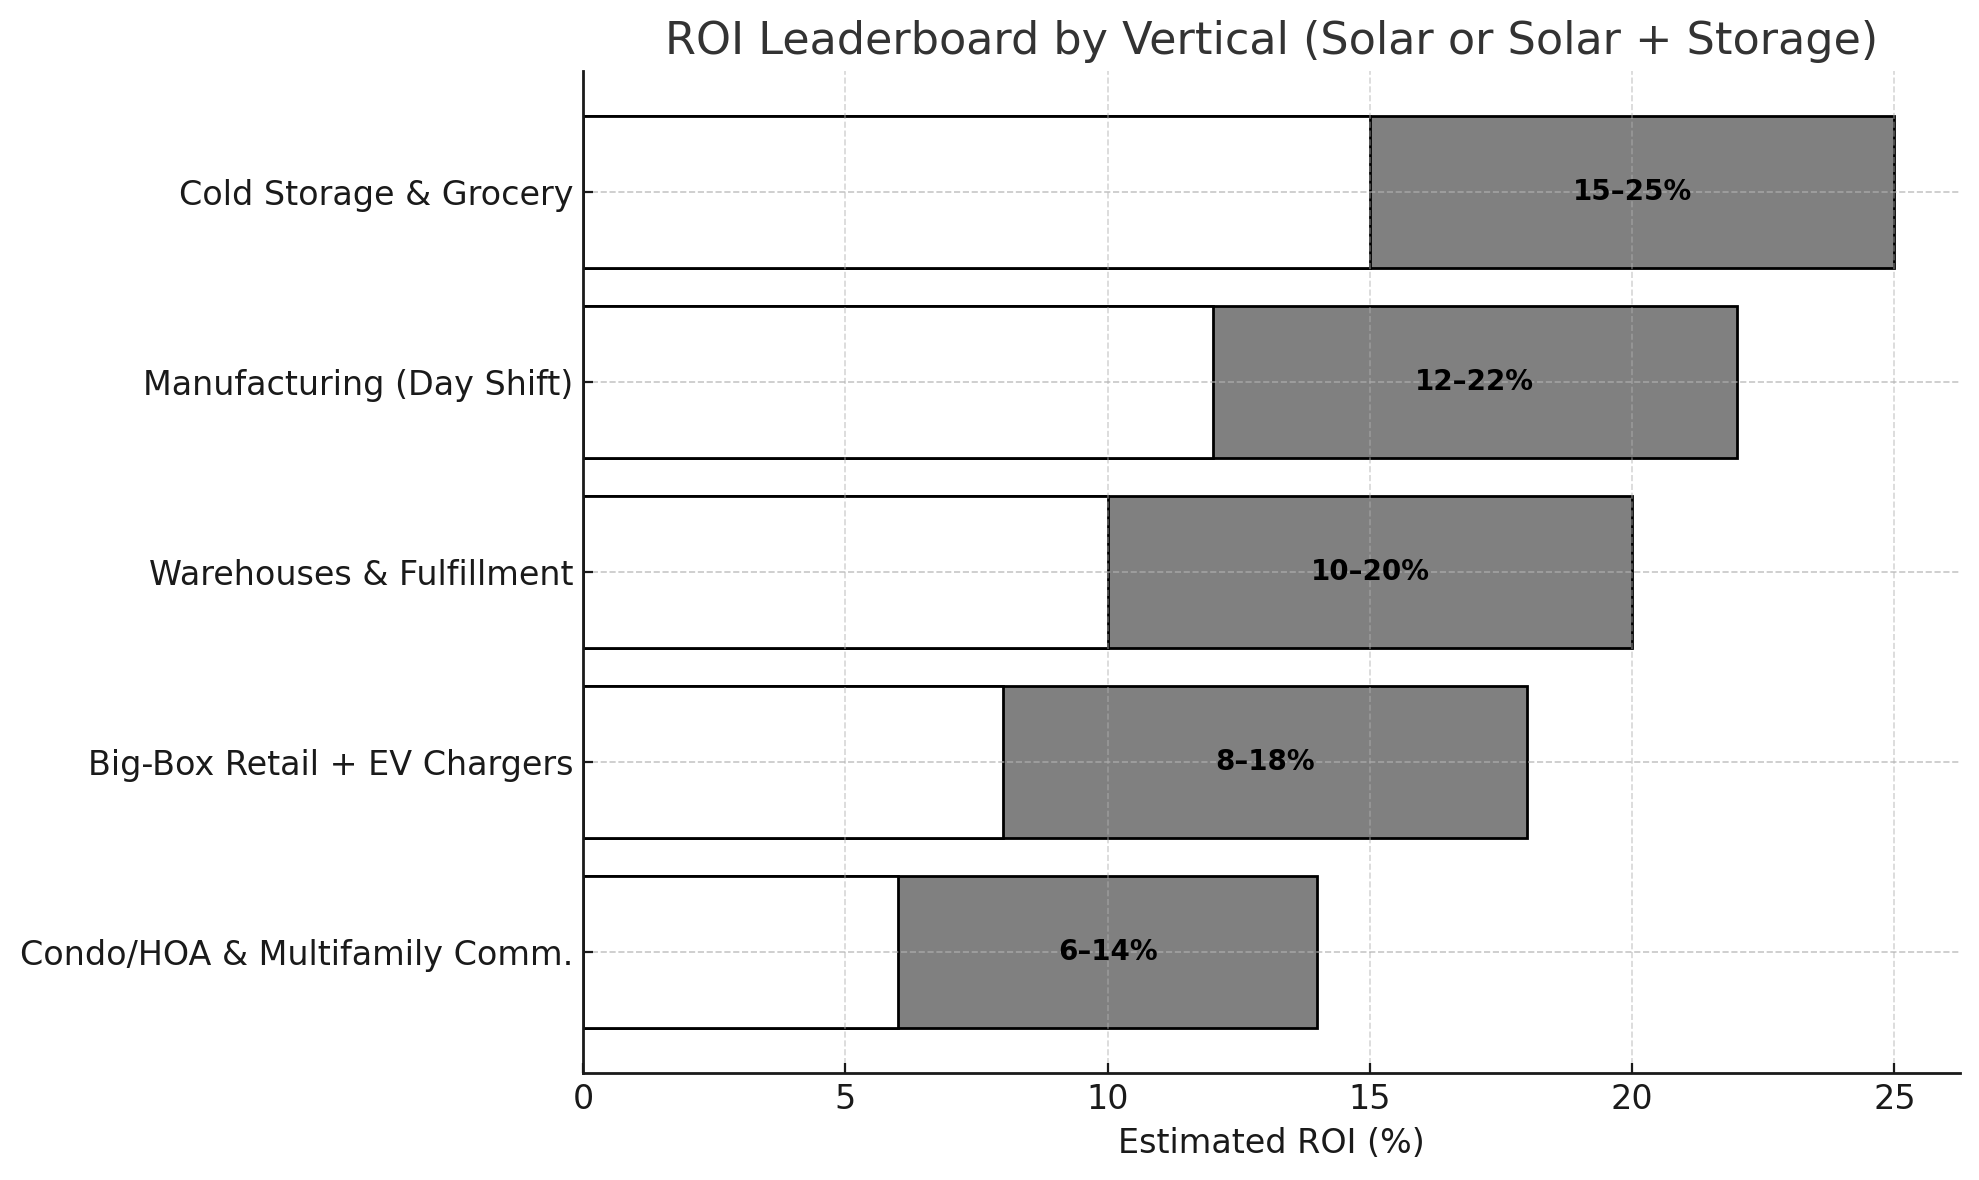
No-Brainer Business Types and Sites (Highest ROI)
Warehouses and Fulfillment Centers
Modern logistics facilities represent the ideal commercial solar application. Their vast, unobstructed rooftops provide excellent solar real estate, often accommodating 500 kW to 2 MW systems. Daytime operations align perfectly with solar generation curves, and simplified electrical infrastructure enables straightforward interconnection.
These facilities achieve high solar output due to panel density and minimal shading. Reduced grid reliance during peak hours directly lowers energy costs, and pairing with battery storage enables aggressive peak demand shaving. Warehouses frequently achieve 5-7 year paybacks, among the fastest in commercial solar.
Condo, HOA, and Multifamily (Common Areas)
Residential communities with common area loads (hallway lighting, elevators, garage lights, pool pumps, clubhouse HVAC) offer strong solar economics when these loads run through a single master meter. This simplifies interconnection and billing while distributing benefits across all owners or tenants.
Solar offsets shared electricity bills, reducing HOA fees or condo assessments. It adds property value and marketability while providing visible sustainability credentials. These projects avoid the split incentive problems of individual unit metering and typically achieve broad owner support.
Cold Storage and Grocery
Facilities with 24/7 refrigeration needs present exceptional solar opportunities due to their high, steady base loads. Cold storage operations can utilize 80-90% of solar production immediately, minimizing export and maximizing self-consumption value.
These sites are prime candidates for battery storage, using thermal mass and battery systems together for sophisticated load shaping. Batteries shave demand charges while providing critical backup for refrigeration during outages. The combination of high utilization and demand charge reduction often produces 4-6 year paybacks.
Manufacturing (Day Shift Operations)
Manufacturing facilities with daytime production schedules enjoy natural load alignment with solar generation. High kWh consumption combined with steep demand charges creates substantial savings opportunities.
Solar plus storage can simultaneously reduce energy costs and peak demand penalties. Federal and state industrial decarbonization incentives, including grant programs and enhanced tax treatment, can amplify ROI beyond standard solar incentives. Many manufacturers achieve 6-8 year paybacks with comprehensive incentive stacking.
Big-Box Retail with Large Parking Lots
Retail centers offer dual opportunities: rooftop solar and carport canopy systems over expansive parking areas. Carport solar provides customer benefits (shaded parking, weather protection) while generating clean energy. Integration with EV charging infrastructure creates additional amenities and potential revenue streams.
These projects deliver brand and public relations value beyond energy savings. Customer-facing sustainability initiatives differentiate properties and attract environmentally conscious shoppers. Properly designed EV charging can generate revenue while serving as a customer attraction, with some retailers reporting increased dwell time and spending at locations offering charging.
Picking the Right Surface: Roofs, Carports, Canopies, or Adjacent Land
Commercial solar site selection requires careful evaluation of structural, financial, and operational factors. Roof-mounted systems dominate commercial installations due to otherwise-unused space and favorable economics, but roof age and condition matter critically. Installing solar on a roof nearing end-of-life creates expensive complications; best practice calls for re-roofing first or coordinating both projects.
Structural loading capacity determines feasible system size. Ballasted systems (weighted without penetrations) minimize roof warranty concerns but require greater structural capacity than penetrating systems. Older buildings may need structural reinforcement, adding costs that can shift economics toward alternative mounting locations.
Carport and canopy systems over parking lots cost 20-40% more per watt than rooftop solar installations in Medford due to structural requirements but offer compelling benefits: no roof penetrations, easier maintenance access, customer amenities, and natural integration with EV charging infrastructure. Employee or customer parking lots with 100+ spaces often justify the premium, particularly when EV charging is planned.
Small ground-mount systems on adjacent land suit businesses with available property and favorable interconnection points. Ground mounts simplify maintenance, enable optimal tilt angles, and avoid roof warranty complications, but they consume potentially valuable land and may face zoning or setback restrictions.
Load, Tariffs, and Demand Charges: Where the Savings Really Come From
TOU rates reward production in high-price windows. Demand charges often drive 30–70% of a commercial bill, so a brief unmanaged spike can set the month’s costs.6 Solar alone only helps if it’s generating during the exact peak; batteries enable peak shaving and TOU arbitrage, frequently delivering four- and five-figure monthly savings at large sites when correctly sized and dispatched.7 Use 12 months of 15-minute interval data to right-size PV and storage and to model savings accurately.
Sizing & System Design for Commercial Sites
Commercial designs typically target 70–90% annual offset to limit low-value exports and ease interconnection. Inverter loading ratios of ~1.15–1.30 capture shoulder-hour energy cost-effectively. Modern controls integrate PV, storage, building loads, and EV charging to prioritize demand shaving and ROI. Selective storage sizing (targeting peaks vs. whole-facility backup) usually maximizes return.
EV Charging + Solar: From Cost Center to Amenity
Unmanaged Level 2/fast charging can create new monthly peaks and heavy demand charges; studies on DC fast charging show demand fees can dominate operating costs without mitigation.8 Pairing smart charging with PV+storage buffers spikes, aligns charging with solar hours, and can add revenue or employee benefits while protecting the bill.
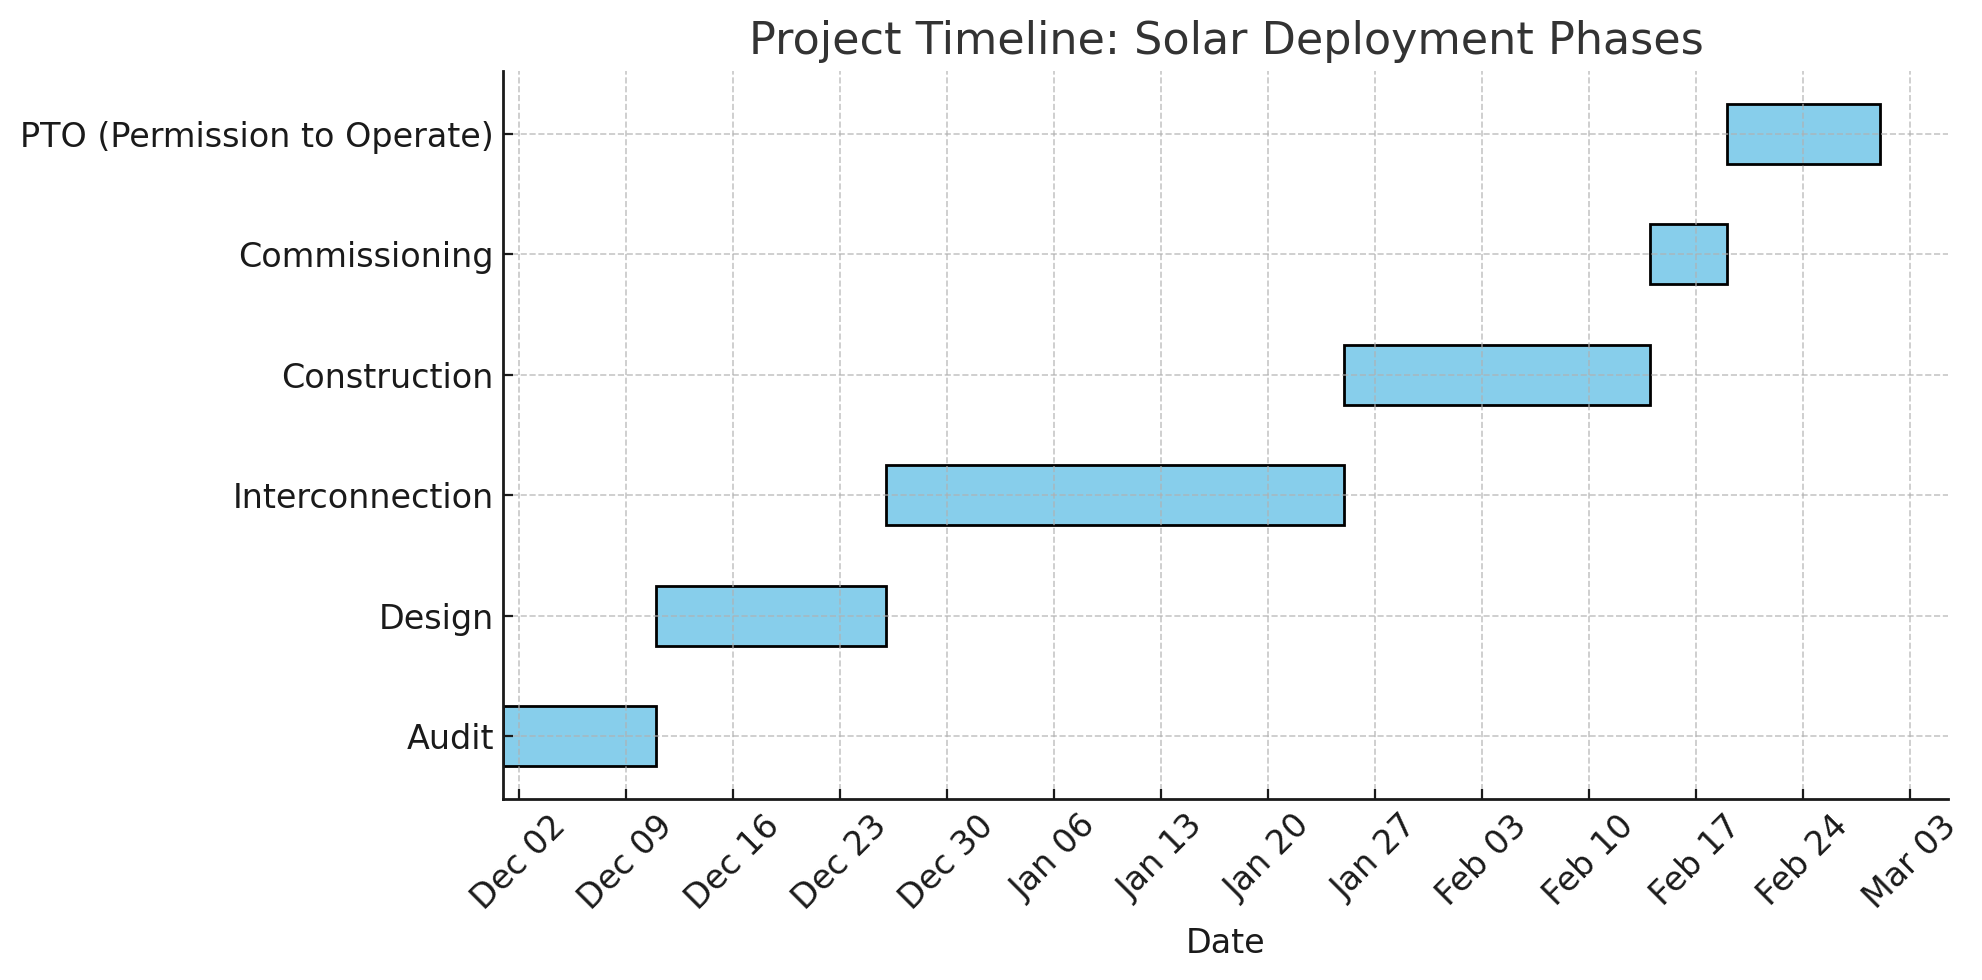
Procurement Pathways & Timeline
RFPs suit large/multi-site portfolios; design-build can speed smaller projects. Evaluate EPCs for bankability, track record, warranties, and performance guarantees (e.g., 90–95% of modeled first-year production). Expect multi-month interconnection/permitting and total timelines commonly ~9–15 months for straightforward projects.
ROI, IRR, and Payback: Making the Numbers Work
Model cash flows with ITC timing, MACRS in years 1–5, O&M, inverter reserve (years ~12–15), rate escalation, and discount rate. Run sensitivity cases (production, demand-charge reduction, escalation). Strong projects often show 10–15% IRR and 5–8 year paybacks under base assumptions; exceptional sites (high demand charges, strong incentives, favorable financing) can do even better.
Risk Management & Compliance
Coordinate early on structural/electrical design, roof warranties, and fire code access. Understand interconnection/export limits and potential distribution upgrades. Manage production risk with quality design, monitoring, and contractual remedies. For ESG, retain metering and REC documentation to substantiate Scope 2 reductions.
FAQs for CFOs & Business Owners
Will solar void our roof warranty?
Not if properly installed. Most roof manufacturers will maintain warranties when solar contractors follow approved mounting methods, provide their own workmanship warranties, and coordinate with the roofing company. Get written confirmation before installation.
Who owns the tax benefits under a PPA?
The PPA provider owns the system and claims all tax benefits (ITC, MACRS). You receive lower electricity rates but no direct tax benefits. This trade-off works for tax-exempt entities or companies without sufficient tax appetite.
What happens if we sell the building?
Owned systems can be sold with the building (adding value) or removed. PPAs typically transfer to new owners or require a buyout. C-PACE financing transfers automatically as a property assessment. Address this in sale agreements.
How do net metering rules affect system size?
Net metering caps vary by state and utility. Some limit system size to 100-120% of annual consumption; others restrict export compensation or impose demand charges on exported power. Design around these constraints.
Can the system provide backup power during outages? Standard grid-tied systems shut down during outages for safety. Backup requires battery storage with islanding capability or a special backup configuration. Not all batteries support backup; clarify requirements during design.
What production guarantees should we expect?
Reputable EPCs guarantee 90-95% of modeled production over the first year. Multi-year guarantees may cover years 1-10 with degradation curves. Ensure guarantees include remedies (cash payments or system modifications) for underperformance.
Who handles measurement and verification?
Production monitoring systems provide real-time M&V. Third-party verification may be required for performance-based incentives or ESG reporting. Define M&V protocols and reporting frequency in contracts.
Do we own the renewable energy credits (RECs)?
Under ownership models, you typically own RECs unless separately sold. Under PPAs, the system owner usually retains RECs. REC ownership matters for ESG claims and green power marketing; clarify in agreements.
How does solar impact ESG reporting?
Solar provides quantifiable Scope 2 emissions reductions (purchased electricity). Proper metering supports credible disclosure under GRI, CDP, TCFD, or SEC climate disclosure rules. Retain documentation for audits.
What about cybersecurity for controls and chargers?
Modern systems connect to networks for monitoring and control. Implement cybersecurity best practices: separate VLANs, strong authentication, regular firmware updates, and monitoring for unusual activity. Address in IT security policies.
Sources
- U.S. Energy Information Administration. (2025, May 14). Retail electricity prices have increased faster than inflation since 2022, and we expect them to continue increasing through 2026. Today in Energy. https://www.eia.gov/todayinenergy/detail.php?id=65284
- U.S. Department of Energy, Office of Energy Efficiency & Renewable Energy. (2024, February). Federal solar tax credits for businesses. Better Buildings Solution Center. https://betterbuildingssolutioncenter.energy.gov/sites/default/files/attachments/Federal-Solar-Tax-Credits-for-Businesses.pdf
- Internal Revenue Service. (2024). Publication 946: How to depreciate property. https://www.irs.gov/publications/p946
- U.S. Department of Energy, Office of Energy Efficiency & Renewable Energy. (2025). 179D Energy Efficient Commercial Buildings Tax Deduction. https://www.energy.gov/eere/buildings/179d-energy-efficient-commercial-buildings-tax-deduction
- U.S. Environmental Protection Agency. (2025, July 1). Commercial Property Assessed Clean Energy (C-PACE). https://www.epa.gov/statelocalenergy/commercial-property-assessed-clean-energy
- National Renewable Energy Laboratory. (2025, January 9). Analysis identifies where commercial customers benefit from battery energy storage [News/press]. https://www.nrel.gov/manufacturing/news/press/2017/where-commercial-customers-benefit-from-battery-energy-storage
- Gagnon, P., et al. (2017). Solar + storage synergies for managing commercial demand charges (NREL/TP-6A20-70360). National Renewable Energy Laboratory. https://docs.nrel.gov/docs/fy18osti/70360.pdf
- Bernal, D., et al. (2024). Assessment of economic viability of direct current fast charging stations (NREL/TP-91021). National Renewable Energy Laboratory. https://docs.nrel.gov/docs/fy24osti/91021.pdf
- Internal Revenue Service. (n.d.). Credits and deductions under the Inflation Reduction Act of 2022: Elective payment and credit transfer. https://www.irs.gov/credits-and-deductions-under-the-inflation-reduction-act-of-2022
- Solar Energy Industries Association. (2024). Prevailing wage and apprenticeship requirements for clean energy tax credits. https://seia.org/prevailing-wage-apprenticeships/